
Power quality disturbances can be generated from both the utility and customer sides of the distribution network. Utility generated disturbances are typically caused by events related to the following:
- Transformers - Tap-switching generates transients
- Protective Apparatus - Re-closure of circuit breakers causes cycling of power (This includes: Fuses, circuit breakers, lightning arresters and suppressors, insulators, and switches)
- Corrective Apparatus - Power factor correction capacitors and voltage regulating equipment generate spikes and transients
Disturbances to power quality generated from the customer-side are typically the result of:
- Grounding mistakes - Multiple N-G bonds
- Wiring errors and electrical code violations: Reversed polarity
- Nonlinear loads - Switch power supplies and pulse rectification
- System not designed properly - High impedance neutrals
- Interference from other devices or loads - For example, the lights flicker when an air conditioner comes on may indicate that the air conditioner is on the same circuit as other electronic equipment
- Some equipment is sensitive to utility operations - Capacitors switching
- Operation of portable radio transmitters near electronic equipment
- Electro-static discharge
Interruptions to power service resulting from a fault in the power system are not necessarily power quality issues. These faults are typically due to physical impacts to the distribution network by:
Trees
- Lightning
- Equipment Failure
- Wind
- Animals
- Icing
- Public Interference
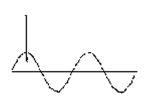
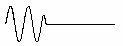
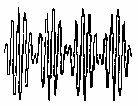
Transients
|
Impulsive Transient |
|
|---|---|
 |
|
|
Causes |
|
|
Impacts |
|
|
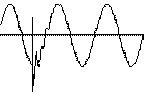
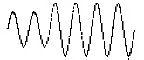
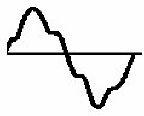
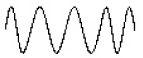
Oscillatory Transient |
|
|---|---|
 |
|
| Low Frequency Transients | <500 Hz, <30 cycles |
| Causes |
|
| Impacts |
|
| Medium Frequency Transients | 500 Hz - 2 kHz, < 3 cycles |
| Causes |
|
| Impacts | Failure of customer equipment |
| High Frequency Transients | >2 kHz, < 0.5 cycle |
| Causes |
|
| Impacts |
|
Short Duration Voltage Variations
|
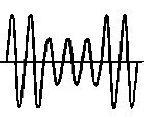
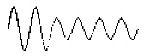
Voltage Sags (dips) |
|
|---|---|
 |
|
|
Causes |
|
|
Impacts |
|
|
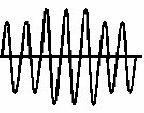
Voltage Swells (surges) |
|
|---|---|
 |
|
| Causes | Single-line-to-ground faults |
| Impacts |
|
Long Duration Voltage Variations
|
Overvoltage |
|
|---|---|
 |
Increase in the rms voltage greater than 110 percent at the power frequency for a duration longer than 1 min. |
|
Causes |
|
|
Impacts |
|
|
Undervoltage |
|
|---|---|
 |
|
|
Causes |
|
|
Impacts |
|
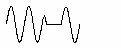
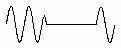
Interruptions
 |
|
 |
|
 |
Long-Term Interruption (outage): > 1 minute |
|
Causes |
|
|
Impacts |
|
Waveform Distortions
|
Harmonics: |
|
|---|---|
 |
Nonlinear loads, such as power electronic equipment, produce non-sinusoidal current waveforms when energized with a sinusoidal voltage. They inject currents at harmonic (integer multiple of the fundamental frequency) frequencies into the system. Harmonic currents, and the voltage distortion they create as they flow through the system impedance, can reduce equipment operating reliability and service life (0-100th harmonic). |
|
Causes |
|
|
Impacts |
|
|
Notching: |
|
|---|---|
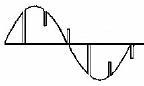 |
|
|
Causes |
|
|
Impacts |
|
|
Noise: |
|
|---|---|
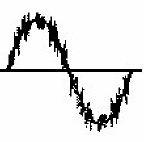 |
Any unwanted electrical signals with broadband spectral content lower than 200 kHz superimposed upon the power system voltage or current in phase conductors, or found on neutral conductors or signal lines. |
|
Causes |
|
|
Impacts |
|
Voltage Fluctuation
|
Voltage Fluctuation (flicker): |
|
|---|---|
 |
The impact of the voltage fluctuation on lamps such that they are perceived to flicker by the human eye. This is due to loads which exhibit continuous, rapid variations in the load current, particularly the reactive component. |
|
Causes |
|
|
Impacts |
|
Frequency Variation
|
Frequency Variation: |
|
|---|---|
 |
The deviation of the power system fundamental frequency from its specified nominal value (e.g., 50 or 60 Hz). |
|
Causes |
|
|
Impacts |
|